

Using Story Points in the Real World
Using Story Points in the Real World
Well, as real as this world can be, I suppose

Other posts in this series about Story Points:
Another theme identified by the questions about Story Points from my AgileAI experiment was how to estimate and track work using them.
How do I estimate using points?
How do I properly track story points?
How do I introduce a team to story points?
Estimating Using Story Points

Way back at the start of this century when I learned Extreme Programming, the community was in the process of transitioning from time-based estimation to the use of Story Points. As I mentioned in What’s the (Story) Point?, the intent was to remove the notion of time from the estimates for a number of reasons. Story Points were introduced as a means for evaluating the relative effort of work items against one another. The only allowable values, initially, were 1, 2 and 3, with anything larger needing to be split.
The key part of that statement is “relative effort”. We weren’t trying to determine the exact number of days or hours a story would take to deliver, but instead the size of the effort of Story A compared to Story B compared to Story C. The reasoning is that we humans aren’t great at precision estimation but we’re actually reasonably good when determining the size of on thing relative to another. Try this exercise:

Look at the image of the books above and tell me how many pages are in each book.
Now, if “Book 9” is a 1, tell me how large “Book 7” is relative to it. How large is “Book 6” relative to “Book 9”?
Your first estimates will be very precise but will be wrong, sometimes significantly so. Your second estimates won’t be precise but will be much more accurate.
This was the premise behind Story Points - accuracy over precision.
Tracking Using Story Points
When we used this approach, at the start we still didn’t know how many Story Points we could complete in an iteration. We might take a guess, but it was still nothing more than that. There was no way of knowing up front how many points a team could complete until they started the work and had real data.
Once we had a single data point, we could make some decisions. For example, if we completed 15 points in a 2-week iteration, we would only consider pulling in 15 points of work during the next iteration planning meeting. We still didn’t have enough data, though, to extrapolate beyond that iteration.
Let’s look at an example. The data for these charts aren’t real but do reflect what I’ve seen many times. We have a team that has dutifully estimated their work and has a total scope for a release of 200 Story Points. Before beginning work on the release, they believe it will take 17 iterations to complete it.
After the first iteration, they completed 15 points:

This is great, but again a single data point doesn’t represent a trend! After two, or even better three, iterations, we began to have enough data to see the pattern emerge:

Now we’re seeing something interesting! After a first iteration that showed a trend of completing all of the work early, having more data actually shows the opposite - that we won’t complete everything in 17 iterations.
Moving along a few iterations:
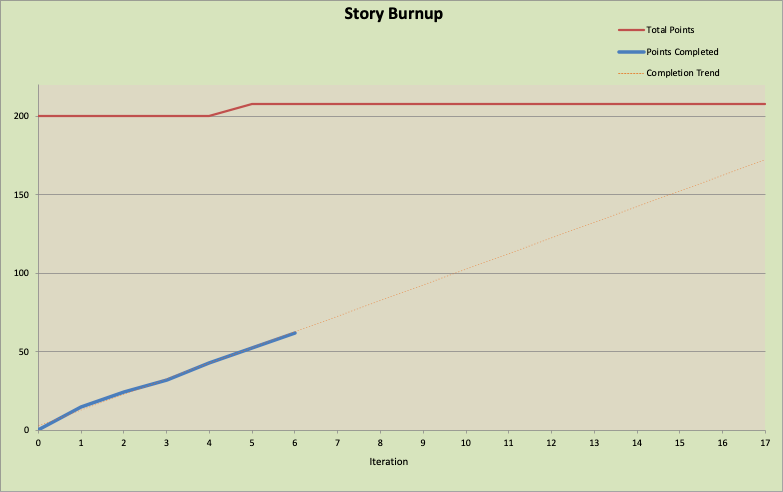
We can see two things in this chart after 6 iterations. First, there was an inevitable addition to the scope of the release. Now, instead of 200 points of work, it’s 208. That’s not too bad, so we’ll go with it.
Second, though, we see that the trend from our actual rate of completing work still shows that we won’t even complete the initial 200 points before the 17 iterations are up. Most teams in this situation will be optimistic that they can increase their velocity and will still stick to hitting both the scope and time limits they were given. Hands up, everyone who has been on a team that has done this. What’s that? Everyone! 😀
Later on:

You can see in the chart after Iteration 12 that there was another scope increase after Iteration 8, to 215 points. After Iteration 11, though, the team and Customer/Product Owner finally had a real conversation about how much they were going to complete by the end of the release. The Customer/Product Owner decided that releasing after Iteration 17 was more important than completing all of the scope, so together they spent time determining what stories should still be delivered and what ones could be deferred. In doing so, they reduced the total scope to 185 points, which is very close to what the trendline suggests will be completed.

In the end, the team was indeed able to complete all the stories, totalling 185 points.
Note that these charts were generated using MS Excel. You don’t necessarily need a tool like Jira to track a team’s work!
Introducing a Team to Story Points

I will have some rather controversial things to say on this topic in the next post in this series, but for now I will continue with how I once taught teams in the use of Story Points.
First, please, please, please don’t use the Fibonacci series for the allowable values for Story Points. It gives pseudo-scientific credence to something that is anything but scientific! The values aren’t even from the real Fibonacci series, so it has been called “modified Fibonacci”. The only aspect of Fibonacci that truly applies is the first three letters: “fib”. The Merriam-Webster English dictionary defines “fib” as “a trivial or childish lie”.
Limit yourself to the original allowable values for Story Points - 1, 2 and 3 - and if any story is deemed larger then it must be split. Story splitting, by the way, is an entire topic on its own. I highly recommend that you learn how to split stories well, then estimation and tracking become much, much easier.
Beyond that, refer to the first two sections of this post for pointers on how to use Story Points for relative estimation of work. Remember that you should NOT equate Story Points to time and especially that Points will vary from team to team.
Story Points were intended to simplify estimation and, in general, they did. However, over time the original intent of their use has been lost and they’ve become equated with time. The fake Fibonacci series provided far too many values from which a team could select when estimating stories, which also contributed to losing the plot on relative estimation vs. absolute estimation.
Stay tuned for my next post in this series which will examine why we should no longer use Story Points at all and what to do instead!